International

News release
From:
September smashes monthly temperature record
Earth just had the hottest September on record – and by a record-breaking margin, according to a leading international dataset which is used by the World Meteorological Organization (WMO) for its State of the Global Climate monitoring.
This continues an extended streak of extraordinary land and sea-surface temperatures and is an ominous signal about the speed with which greenhouse gases are changing our climate. The year 2023 is now on track to be the warmest year on record. Numerous high temperature records have been broken in recent months.
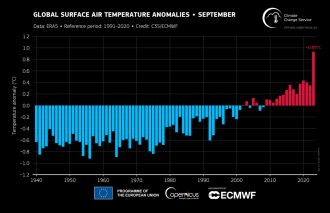
According to the EU’s Copernicus Climate Change Service (C3S) implemented by the European Center for Medium Range Weather Forecasts, September had an average surface temperature of 16.38°C. This was 0.5°C above the temperature of the previous warmest September, in 2020, and around 1.75°C warmer for the month of September compared to the pre-industrial reference 1850-1900 period.
“Since June, the world has experienced unprecedented heat on land and sea. The temperature anomalies are enormous – far bigger than anything we have ever seen in the past. Antarctic winter sea ice extent was the lowest on record for the time of year. What is especially worrying is that the warming El Niño event is still developing, and so we can expect these record-breaking temperatures to continue for months, with cascading impacts on our environment and society,” said WMO Secretary-General Prof. Petteri Taalas.
“WMO will work with our partners in the scientific community to try to understand what additional factors are contributing to this exceptional warming,” said Prof. Taalas.
WMO combines the C3S reanalysis dataset (called ERA5) with five other leading international datasets for its climate monitoring activities. The WMO provisional State of the Global Climate 2023 will be released at the start of the UN climate change conference, COP28, in Dubai in November.
"The unprecedented temperatures for the time of year observed in September - following a record summer - have broken records by an extraordinary amount. This extreme month has pushed 2023 into the dubious honour of first place - on track to be the warmest year and around 1.4°C above preindustrial average temperatures. Two months out from COP28 – the sense of urgency for ambitious climate action has never been more critical,” said Samantha Burgess, Deputy Director of the Copernicus Climate Change Service.
The September monthly figures were published as a new synthesis report from the UN Convention on Climate Change previewed Parties’ blueprint for decisions on the global stocktake at COP28.
The Paris Agreement sets long-term goals to guide all nations to substantially reduce global greenhouse gas emissions to limit the global temperature increase in this century to 2 °C while pursuing efforts to limit the increase even further to 1.5 °C, to avoid or reduce adverse impacts and related losses and damages.
The fact that an individual month, or year, exceeds the 1.5 °C limit does not mean that we have exceeded the 1.5°C level specified in the Paris Agreement because that refers to long-term warming over many years.
Key points:
- The September 2023 global temperature was the most anomalous warm month of any year in the ERA5 dataset (back to 1940).
- September 2023 was 0.93°C warmer than the 1991-2020 baseline which is used as a practical tool for climate sensitive sectors like agriculture.
- The global temperature for January-September 2023 was 0.05°C higher than the equivalent period in the warmest calendar year (2016) and 1.40°C higher than the preindustrial average (1850-1900).
- Europe had its warmest September on record, at 1.1°C higher than 2020, the previous warmest September, with many national temperature records. The heat has continued into October.
- The average sea surface temperature for September over 60°S–60°N (the extrapolar ocean) reached 20.92°C, the highest on record for September and the second highest across all months, behind August 2023.
- El Niño conditions continue to develop over the equatorial eastern Pacific.
Sea Ice
- Antarctic sea ice extent remained at a record low level for the time of year.
- Both the daily and monthly extents reached their lowest annual maxima in the satellite record in September, with the monthly extent 9% below average.
- The daily Arctic Sea ice extent reached its 6th lowest annual minimum while the monthly sea ice extent ranked 5th lowest, at 18% below average.
The Copernicus Climate Change Service monthly bulletin is available here
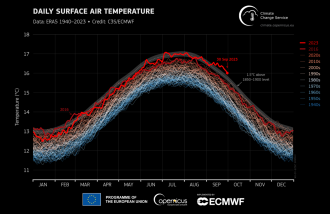
Global daily surface air temperature (°C) from 1 January 1940 to 30 September 2023, plotted as time series for each year. 2023 and 2016 are shown with thick lines shaded in bright red and dark red, respectively. Other years are shown with thin lines and shaded according to the decade, from blue (1940s) to brick red (2020s). The dotted line and grey envelope represent the 1.5°C threshold above preindustrial level (1850–1900) and its uncertainty. Data source: ERA5. Credit: Copernicus Climate Change Service/ECMWF.
Multimedia