Media Release
From: Centre for Eye Research Australia (CERA)Australian scientists have led the development of the world’s most detailed gene map of the human retina, providing new insights which will help future research to prevent and treat blindness.
The retina is the latest part of the human body and the first part of the eye to be mapped as part of the Human Cell Atlas Project – a global project to create reference maps of all human cells to better understand, diagnose and treat disease.
It is also the first time an Australian group has contributed to the project.
The study, led by Dr Raymond Wong from the Centre for Eye Research Australia and University of Melbourne, Dr Samuel Lukowski from the Institute for Molecular Bioscience at the University of Queensland and Associate Professor Joseph Powell from the Garvan Institute of Medical Research, is published in the European Molecular Biological Organisation (EMBO) Journal.
Dr Wong says the study provides unprecedented insights into the genetic signals of cells in the retina – the thin layer of cells at the back of eye that sense light and send messages to the brain via the optic nerve to enable us to see.
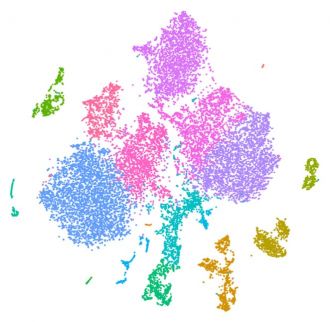
The group examined the complex genetic sequences behind more than 20,000 individual cells to develop a profile of all major cell types in the retina and the genes they ‘express’ to function normally.
Cells mapped include photoreceptors which sense light and allow people to see, the retinal ganglion cells which transmit messages to the brain along the optic nerve and other cells which support the function and stability of the retina.
“By creating a genetic map of the human retina, we can understand the factors that enable cells to keep functioning and contribute to healthy vision,’’ says Dr Wong.
“It can also help us understand the genetic signals that cause a cell to stop functioning, leading to vision loss and blindness.’’
Associate Professor Powell says the retinal cell atlas will benefit researchers investigating Inherited Retinal Diseases, which occur when genetic ‘mistakes’ cause retinal cells to stop functioning, leading to vision loss and blindness.
“More than 200 genes are known to be associated with retinal diseases and having a detailed gene profile of individual retinal cell types, will help us study how those genes impact on different kinds of cells.
“This understanding is the first step to better identifying what causes disease and ultimately developing treatments.’’
Dr Wong says the atlas will also help scientists conducting research in the emerging area of cell therapy – which could replace faulty retinal cells with new ones developed from induced pluripotent stem cells in the lab.
“The retinal cell atlas will give scientists a clear benchmark to assess the quality of the cells derived from stem cells to determine whether they have the correct genetic code which will enable them to function.’’
Dr Lukowski says the research offers ‘extraordinary potential’.
“We can now build upon this atlas of healthy cells with those from other retinal diseases and across different stages of human development, which will provide the community with powerful tools for disease prediction,” he says.
According to Associate Professor Powell, cutting-edge cellular genomics technology will transform our understanding of health and disease.
“Cellular genomics is allowing us to see the human body at a higher resolution than ever before. The insights that researchers worldwide can gain from this atlas present an entirely new way to approach treatment and prevent eye disease.”
· Dr Wong, Dr Lukowski and Associate Professor Powell are part of the ANZ Human Eye Cell Atlas Consortium, a group of scientists from 20 partnering institutes and universities from Australia and New Zealand creating reference maps for different parts of the human eye.
· You can read the full article Lukowski S, Lo C, Sharov A, Nguyen Q, Fang L, Hung S, Zhu L, Zhang T, Grünert U, Nguyen T, Senabouth A, Jabbari J, Welby E, Sowden J, Waugh H, Mackey A, Pollock G, Lamb T, Wang PY, Hewitt A, Gillies M, Powell J, Wong R (2019) A single-cell transcriptome atlas of the adult human retina. at EMBO Journal, doi: 10.15252/embj.2018100811