
 International
News release
From:
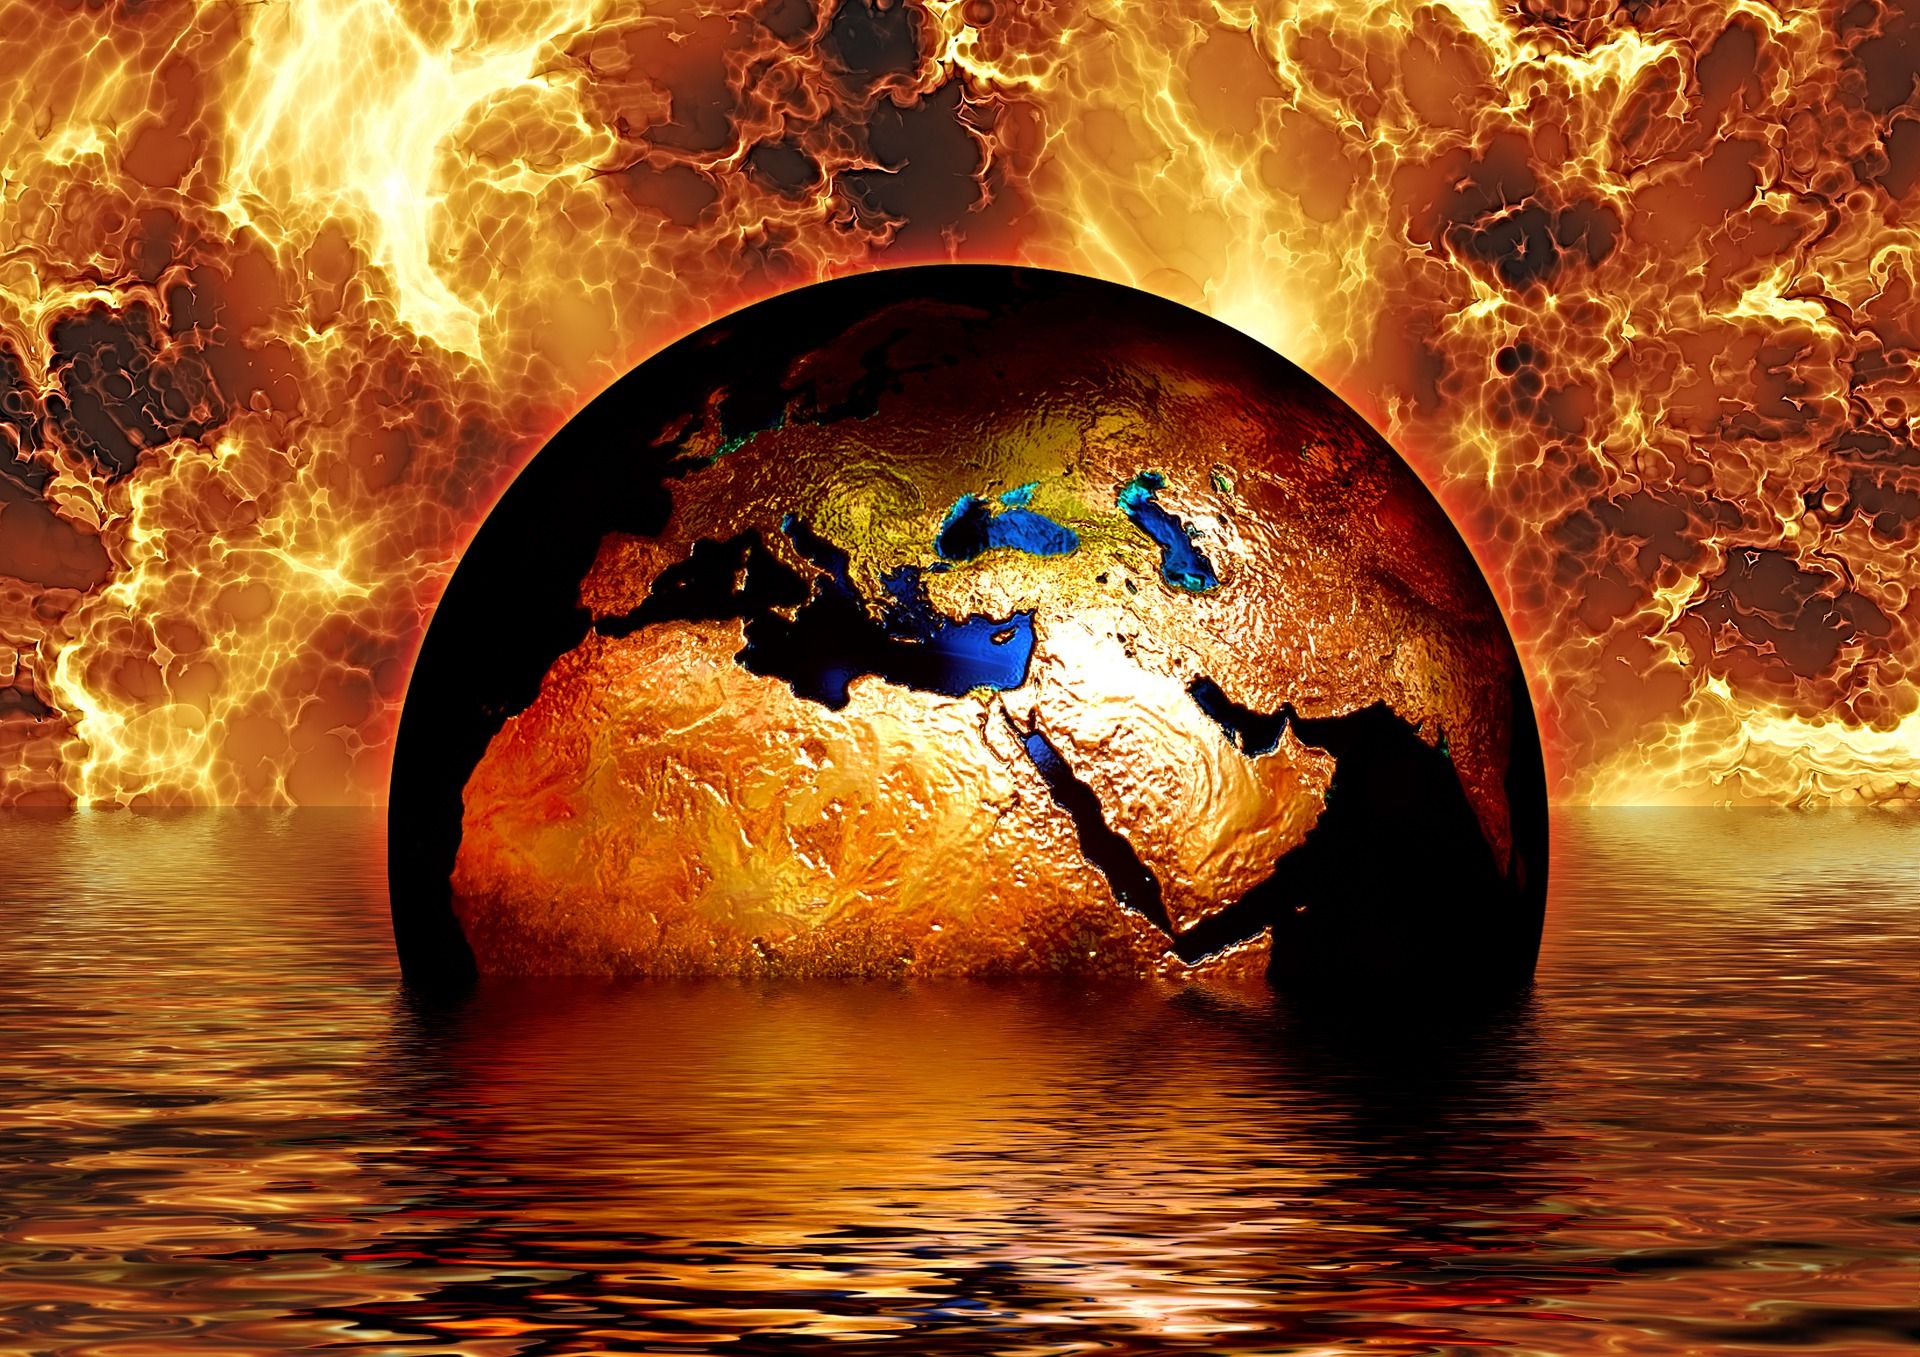
2017 is set to be in top three hottest years, with record-breaking extreme weather
WMO report highlights impacts on human safety, well-being and environment
6 November 2017 (WMO) - It is very likely that 2017 will be one of the three hottest years on record, with many high-impact events including catastrophic hurricanes and floods, debilitating heatwaves and drought. Long-term indicators of climate change such as increasing carbon dioxide concentrations, sea level rise and ocean acidification continue unabated. Arctic sea ice coverage remains below average and previously stable Antarctic sea ice extent was at or near a record low.
The World Meteorological Organization’s provisional Statement on the State of the Climate says the average global temperature from January to September 2017 was approximately 1.1°C above the pre-industrial era. As a result of a powerful El Niño, 2016 is likely to remain the warmest year on record, with 2017 and 2015 being second and/or third. 2013-2017 is set to be the warmest five-year period on record.
The WMO statement – which covers January to September - was released on the opening day of the United Nations climate change conference in Bonn. It includes information submitted by a wide range of UN agencies on human, socio-economic and environmental impacts as part of a drive to provide a more comprehensive, UN-wide policy brief for decision makers on the interplay between weather, climate and water and the UN global goals.
“The past three years have all been in the top three years in terms of temperature records. This is part of a long term warming trend,” said WMO Secretary-General Petteri Taalas. “We have witnessed extraordinary weather, including temperatures topping 50 degrees Celsius in Asia, record-breaking hurricanes in rapid succession in the Caribbean and Atlantic reaching as far as Ireland, devastating monsoon flooding affecting many millions of people and a relentless drought in East Africa.
“Many of these events – and detailed scientific studies will determine exactly how many – bear the tell-tale sign of climate change caused by increased greenhouse gas concentrations from human activities,” he said.
Patricia Espinosa, Executive Secretary of UN Climate Change which is hosting the Bonn conference, said: “These findings underline the rising risks to people, economies and the very fabric of life on Earth if we fail to get on track with the aims and ambitions of the Paris Agreement”.
“There is unprecedented and very welcome momentum among governments, but also cities, states, territories, regions, business and civil society. Bonn 2017 needs to be the launch pad towards the next, higher level of ambition by all nations and all sectors of society as we look to de-risk the future and maximize the opportunities from a fresh, forward-looking and sustainable development path, “she added.
Extreme events affect the food security of millions of people, especially the most vulnerable. A review of the Food and Agriculture Organisation (FAO) found that, in developing countries, agriculture (crops, livestock, fisheries, aquaculture and forestry) accounted for 26% of all the damage and loss associated with medium to large-scale storms, floods and drought.
According to the World Health Organisation (WHO), the global health impacts of heatwaves depend not only on the overall warming trend, but on how heatwaves are distributed across where people live. Recent research shows that the overall risk of heat-related illness or death has climbed steadily since 1980, with around 30% of the world’s population now living in climatic conditions that deliver prolonged extreme heatwaves. Between 2000 and 2016, the number of vulnerable people exposed to heatwave events has increased by approximately 125 million.
In 2016, 23.5 million people were displaced during weather-related disasters. Consistent with previous years, the majority of these internal displacements were associated with floods or storms and occurred in the Asia-Pacific region. In Somalia, more than 760 000 internal displacements have been reported, according to the UN High Commissioner for Refugees and International Organisation for Migration (IOM)
The latest International Monetary Fund (IMF) World Economic Outlook indicates that adverse consequences are concentrated in countries with relatively hot climates and which are home to close to 60% of current global population.
Selected Highlights
Global temperatures in 2017
Global mean temperature for the period January to September 2017 was 0.47°±0.08°C warmer than the 1981-2010 average (estimated at 14.31°C). This represents an approximately 1.1°C increase in temperature since the pre-industrial period. Parts of southern Europe, including Italy, North Africa, parts of east and southern Africa and the Asian part of the Russian Federation were record warm and China was the equal warmest. The northwestern USA and western Canada were cooler than the 1981-2010 average.
Temperatures in 2016 and, to an extent, 2015, were boosted by an exceptionally strong El Niño. 2017 is set to be the warmest year on record without an El Niño influence. The five-year average 2013-2017 is provisionally 0.40°C warmer than the 1981-2010 average and approximately 1.03°C above the pre-industrial period and is likely to be the hottest on record.
The WMO statement is based on five independently maintained global temperature data sets. WMO now uses 1981-2010 instead of the previous 1961-1990 baseline as it is more representative of current climatic conditions and allows for more consistent reporting of information from satellite and reanalysis systems (some of which do not extend back to 1960) alongside more traditional data sets based on surface-observations. The change in the baselines has no influence on trend analysis.
Precipitation:
Southern South America (particularly in Argentina), western China, and parts of southeast Asia were wetter than average. January to September was the wettest on record for the contiguous United States. Rainfall was generally close to average in Brazil, and near to above average in northwest South America and Central America, easing droughts associated with the 2015-16 El Niño. The 2017 rainy season saw above-average rainfall over many parts of the Sahel, with flooding in some regions (especially in Niger).
All-India rainfall for the 2017 monsoon season (June to September) was 5% below average. However, above-average rainfall in the northeast, and adjacent countries led to significant flooding.
The Canadian Prairies, the Mediterranean region, Somalia, Mongolia, Gabon and southwestern South Africa all received lower rainfall than average. Italy had its driest January to September on record.
Ice and snow:
Arctic sea-ice extent was well below average throughout 2017 and was at record-low levels for the first four months of the year, according to the National Snow and Ice Data Center and the Copernicus Climate Change Service. The Arctic annual maximum extent in early March was among the five lowest in the 1979-2017 satellite record, and according to the NSIDC’s data was record low. The five lowest maximum extents have occurred since 2006.
A strong and persistent low pressure system over the central Arctic helped to inhibit ice loss during the summer months. The Arctic sea ice extent minimum in mid-September was 25- 31% below the 1981-2010 average, and among the eight smallest minimum extents on record. The ten smallest minimum extents have all occurred since 2007.
Antarctic sea ice extent was also well below average. The annual minimum extent in early March was record low, and the annual maximum extent in mid-October was at or near record low levels. Sea ice conditions in the Antarctic have been highly variable over the past several years with the record large sea ice extents occurring as recently as 2015.
Northern Hemisphere snow cover extent was 10.54 million square km, near the median value in the 1967-2017 satellite record.
The Greenland ice sheet saw an increase of more than 40 billion tons of ice due to above-average snowfall and a short melt season. Despite the gain in overall ice mass this year, it is only a small departure from the declining trend, with the Greenland ice sheet having lost approximately 3,600 billion tons of ice mass since 2002.
Sea level:
The global mean sea level (GMSL) is one of the best climate change indicators. Global mean sea level has been relatively stable in 2017 to date, similar to levels first reached in late 2015. This is because the temporary influence of the 2015-16 El Niño (during which GMSL peaked in early 2016 at around 10 millimetres above the 2004-2015 trend) continues to unwind and GMSL is reverting to values closer to the long-term trend. Preliminary data indicate that a rise in GMSL may have started to resume from July-August 2017 onwards.
Ocean Heat:
Global sea surface temperatures are on track to be among the three highest on record. Global ocean heat content in 2017 to date has been at or near record high levels. Elevated tropical sea surface temperatures which contribute to coral bleaching were not as widespread as during the 2015-16 El Niño. But some significant coral bleaching did still occur, including the Australia’s Great Barrier Reef. UNESCO reported in June that all but three of the 29 coral reefs with World Heritage listing had experienced temperatures consistent with bleaching at some point in the 2014-2017 period.
Ocean Acidification:
According to the Intergovernmental Oceanographic Commission of UNESCO the ocean absorbs up to 30% of the annual emissions of anthropogenic CO2 in the atmosphere, helping to alleviate the impacts of climate change on the planet. However, this comes at a steep ecological cost, as the absorbed CO2 changes acidity levels in the ocean. Since records at Aloha station (north of Hawaii) began in the late 1980s, seawater pH has progressively fallen, from values above 8.10 in the early 1980s to between 8.04 and 8.09 in the last five years.
Ocean acidification is directly influencing the health of coral reefs and the survival and calcification of several key organisms. These have cascading effects within the food web and impact aquaculture and coastal economies.
Greenhouse gases:
The rate of increase in CO2 from 2015 to 2016 was the highest on record, 3.3 parts per million/year, reaching 403.3 parts per million. Global average figures for 2017 will not be available until late 2018. Real-time data from a number of specific locations indicate that levels of CO2, methane and nitrous oxide continued to increase in 2017.
Extreme Events and Impacts
Tropical cyclones
The North Atlantic had a very active season. The Accumulated Cyclone Energy (ACE) index, a measure of the aggregate intensity and duration of cyclones, had its highest monthly value on record in September.
Three major and high-impact hurricanes occurred in the North Atlantic in rapid succession, with Harvey in August followed by Irma and Maria in September. Harvey made landfall in Texas as a category 4 system and remained near the coast for several days, producing extreme rainfall and flooding. Provisional seven-day rainfall totals reached as high as 1539 mm at a gauge near Nederland, Texas, the largest ever recorded for a single event in the mainland United States.
It was the first time two Category 4 hurricanes (Harvey and Irma) made landfall in the same year in the USA. Irma had winds of 300 km/h for 37 hours – the longest on the satellite record at that intensity and spent three consecutive days as a Category 5 hurricane, also the longest on record. Like Irma, Maria also reached category 5 intensity and caused major destruction on a number of Caribbean islands. In mid-October, Ophelia reached major hurricane (category 3) status more than 1 000 kilometers further northeast than any previous North Atlantic hurricane. It caused substantial damage in Ireland, whilst winds associated with its circulation contributed to severe wildfires in Portugal and northwest Spain.
The WMO Expert Team on Climate Impacts on Tropical Cyclones found that, whilst there is no clear evidence that climate change is making the occurrence of slow-moving, land-falling hurricanes such as Harvey more or less frequent, it is likely that human-induced climate change makes rainfall rates more intense, and that ongoing sea-level rise exacerbates storm surge impacts.
Flooding
Exceptionally heavy rain triggered a landslide in Freetown, Sierra Leone in August, killing more than 500 people. Freetown received 1459.2 mm of rain in two weeks, about four times higher than average. Heavy rainfall contributed to a landslide in Mocoa, southern Colombia, in April, with at least 273 deaths reported.
Many parts of the Indian subcontinent were affected by monsoonal flooding, despite overall seasonal rainfall being near average. The most serious flooding occurred in mid-August in eastern Nepal, northern Bangladesh and nearby northern India. Mawsynram (India) received more than 1 400 mm from 9 to 12 August. Rangpur (Bangladesh) received a month’s worth of rain (360 mm) on 11-12 August. More than 1 200 deaths were reported in India, Bangladesh and Nepal, whilst more than 40 million people were displaced or otherwise affected. The World Health Organization indicated that in Bangladesh alone, more than 13 000 cases of waterborne diseases and respiratory infections were reported during three weeks in August, whilst extensive damage was reported to public health facilities in Nepal.
Flooding affected many parts of Peru in March, killing 75 people and making 70,000 homeless. The Food and Agriculture Organization reported that there were significant crop production losses, particularly maize. Flooding of this type typically affects Peru during the late phase of El Niño events. Whilst there was no Pacific-wide El Niño during 2017, sea surface temperatures near the Peruvian coast in March were 2°C or more above average and similar to El Niño values.
Major flooding occurred mid-year in parts of southern China, especially within the Yangtze River basin. Peak totals from 29 June to 2 July topped 250 mm. Fifty-six deaths were reported and economic losses were estimated at more than US$ 5 billion.
Heavy rain affected the western United States in January and February caused substantial flooding, numerous landslides and the evacuation of tens of thousands of people. It was the wettest winter on record for Nevada, and the second-wettest for California.
Drought
Parts of east Africa continued to be seriously affected by drought. Following well-below-average rainfall in 2016, the 2017 “long rains” season (March to May) was also dry in many parts of Somalia, the northern half of Kenya, and southeastern Ethiopia.
FAO reported that in Somalia, as of June 2017, more than half of the cropland was affected by drought, with herds reduced by 40-60% since December 2016. WFP estimates that the number of people on the brink of famine in Somalia has doubled to 800 000 since February 2017, with half the country needing assistance. WFP has confirmed that more than 11 million people are experiencing severe food insecurity in Somalia, Ethiopia and Kenya.
From November 2016 to mid-June 2017, more than 760 000 drought-related internal displacements in Somalia were recorded by the Protection and Return Monitoring Network (PRMN), a United Nations High Commissioner for Refugees (UNHCR) led project.
Kenya declared the 2017 drought a national disaster. Nairobi faced water shortages that compelled city authorities to ration water, whilst cereal prices rose and GDP figures were hit.
An above-average wet summer season eased drought conditions in southern Africa. But localized drought intensified in the Cape Province.
Heavy winter rains in early 2017 eased long-term drought conditions in California, but resulted in some flooding, and contributed to vegetation growth which may have influenced the severity of wildfires later in the year.
Many parts of the Mediterranean experienced dry conditions. The most severe drought was in Italy, hitting agricultural production and causing a 62% drop in olive oil production compared to 2016. Rainfall averaged over Italy for January-August 2017 was 36% below average. It was also Italy’s hottest January-August on record, with temperatures 1.31°C above the 1981-2010 average. Other dry areas included many parts of Spain and Portugal.
The Democratic People’s Republic of Korea was affected by below‑average rains, impacting key staple crops such as paddy and maize. In the Republic of Korea, rainfall from January to June was 51% below average, the lowest since national records began in 1973.
Major heatwaves
An extreme heatwave affected parts of South America in January. In Chile, numerous locations had their highest temperature on record, including Santiago (37.4°C). In Argentina, the temperature reached 43.5°C on 27 January at Puerto Madryn, the highest ever recorded so far south (43°S) anywhere in the world.
Much of eastern Australia experienced extreme heat in January and February, peaking on 11-12 February when temperatures reached 47°C.
Exceptional heat affected parts of southwest Asia in late May. On 28 May, temperatures reached 54.0°C in Turbat, in the far west of Pakistan near the Iranian border, and also exceeded 50°C in Iran and Oman. A temperature of 53.7°C was recorded at Ahwaz, Iran on 29 June, and Bahrain experienced its hottest August on record.
The Chinese city of Shanghai and the Hong Kong Observatory reported new records of 40.9°C and 36.6 °C during summer.
In the Mediterranean, Cordoba in southern Spain experienced 46.9°C on 12 July and Granada 45.7°C on 13 July. An extensive heatwave in early August led to temperature records in northern and central Italy, Croatia and southern France.
California had its hottest summer on record and extreme heat affected other western states. This culminated in a major heatwave at the end of August and early September, which included a record high temperature (41.1°C) at San Francisco.
Wildfires
Extreme heat and drought contributed to many destructive wildfires.
Chile had the most significant forest fires in its history during the 2016-2017 summer, after exceptionally dry conditions during 2016 followed by extreme heat in December and January. 11 deaths were reported, and a total of 614 000 hectares of forest were burnt, easily the highest seasonal total on record and eight times the long-term average. There were also significant fires during the 2016-2017 Southern Hemisphere summer in various parts of eastern Australia and in the Christchurch region of New Zealand, whilst the southern South African town of Knysna was badly affected by fire in June.
It was a very active fire season in the Mediterranean. The worst single incident occurred in central Portugal in June, with 64 deaths. There were further major fire outbreaks in Portugal and northwestern Spain in mid-October, exacerbated by strong winds associated with Hurricane Ophelia.. Other significant fires affected countries including Croatia, Italy and France.
The area burned in the contiguous United States from January to 19 October was 46% above the 2007-2016 average. The area burned in the western provinces of Canada was about eight times the 2006-2015 seasonal average and contributed to heavy smoke pollution. A wet winter, which allowed the heavy growth of ground vegetation, followed by a dry and hot summer, provided ideal conditions for high-intensity fires in northern California in early October. At least 41 deaths were reported, the worst loss of life in a wildfire in the United States since 1918.
Other noteworthy events
Severe cold and snow affected parts of Argentina in July. After heavy snow had fallen the previous day, the temperature reached −25.4°C in Bariloche on 16 July, 4.3°C below the previous lowest temperature on record there. Other regions where record low temperatures occurred in 2017 included some locations in inland southeastern Australia in early July, where Canberra had its lowest temperature (−8.7°C) since 1971, and the Gulf region in the Middle East in early February.
The United States had its most active tornado season since 2011, with a preliminary total of 1 321 tornadoes in the January to August period, including the second-most active January on record.
Expert Reaction
These comments have been collated by the Science Media Centre to provide a variety of expert perspectives on this issue. Feel free to use these quotes in your stories. Views expressed are the personal opinions of the experts named. They do not represent the views of the SMC or any other organisation unless specifically stated.
Dr Tom Newsome is a Postdoctoral research fellow at the University of Sydney
A key issue in Australia is that climate change exacerbates other threatening processes. In particular, extreme weather events that lead to habitat destruction and large wildfires provide ideal conditions for invasive predators like feral cats and red foxes to move in and decimate native fauna.

Edwina Tanner is from the University of Sydney Marine Studies Institute
The climate is playing out its hand as predicted by climate scientists.
Richard Trethowan is Professor of Plant Breeding, Director, IA Watson Grains Research Centre, Narrabri, University of Sydney
Temperature extremes are already significantly reducing crop productivity and quality.
The race is on to find both genetic and agronomic strategies that minimize the impacts of these extremes. We at the University of Sydney have discovered new genetic diversity that helps wheat tolerate high temperature and we are working with industry to introduce these valuable genes into new cultivars.
Associate Professor Ana Vila Concejo is Deputy Director of the University of Sydney’s One Tree Island Research Station.
Global coral bleaching has caused great damage to coral reefs of the world, including the Great Barrier Reef. The ecological impacts are terrible but there are also physical effects.
Coral reefs are the greatest wave dissipaters of the world, protecting the land behind them from the incoming waves. Reefs without live corals do not provide as much protection; protecting coral reefs means protecting the coasts behind them
Dr Don Clifton from UniSA’s School of Management
The scientific evidence supporting human-caused global warming is overwhelming.
Yet progress to address the problem is still hampered by ideology over evidence, political inaction, and the self-interest of powerful players in industries that are key drivers of our impact on the climate.
We are at high risk of leaving a terrible legacy to future generations who have no say in our actions (and inactions) that impact on them.
We owe it to our children, and their children, and every other species we share the planet with, to get on with the job of taking decisive steps to do what is needed. Hopefully the latest WMO release will help and not end up being just another report put on the evidence pile that has so far failed to trigger the needed action.
Dr Andrew King is an Associate Professor in Climate Science at the University of Melbourne and the ARC Centre of Excellence for 21st Century Weather
Even without an El Niño boost it looks like 2017 will be one of the hottest years on record. This year fits into the long-term trend of global warming with more hot years set to come over the next decade or two. We have now had a little over 1-degree Celsius of global temperature rise due to human-caused climate change and even if we meet the Paris global warming targets we can expect to see more frequent and intense extreme weather events, especially heatwaves, in the future. In that sense 2017 provides a window to our warmer future.
Professor Martina Doblin is the Productive Coasts team leader in the Climate Change Cluster at the University of Technology Sydney
Many animals, including humans, have the capacity to modify their behaviour and seek refuge in the face of environmental stress. For organisms attached to the seafloor, such as marine macroalgae, there is no escape.
The recent WMO update of hotter temperatures therefore spells bad news for these marine primary producers that are known to have upper limits of temperature tolerance. Just as the highly exposed or sensitive members of the human population are at risk of overheating, so are macroalgae and seagrasses. In fact, marine heatwaves experienced in Australia have already caused massive dieback of these important marine primary producers, threatening the socioeconomic benefits provided by coastal ecosystems.
The increased risk of further heat waves (intensive heat over relatively short time scales) as well as exposure to warmer temperatures over the longer term, suggest that recovery will depend on thermally-resistant individuals that may trade-off high temperature tolerance with other important attributes such as nutritional value or rapid growth. Such organisms therefore have the potential of surviving a warming climate, but at the cost of their functional capacity, with cascading impacts to the rest of the ecosystem.
Dr Ashraf Dewan is an Associate Professor from the School of Earth and Planetary Sciences at Curtin University
It is quite clear that Australia and the rest of the world has been suffering from climate extremes, and that we are seeing flooding, extreme temperatures and wild weather more frequently than ever before, and in places never before impacted. For example Canberra experienced the lowest temperature in 46 years when it recorded minus 8.7 in July this year. The City of Shanghai witnessed a record 40.9 degree celcius temperature during summer of 2017. During monsoon season this year, India experienced below average rainfall, while three hurricanes hit the North Atlantic. This new data by WMO is a wakeup call for us as extreme events are increasing exposure of countries and people to a multitude of hazards.
Dr Blair Trewin is the Scientific Coordinator of the WMO Statement
Although 2017 will not be the world's warmest year on record, it will still be warmer than any year before 2015.
2017 saw record-breaking heatwaves in Chile, the Mediterranean, Southwest Asia and California, as well as continuing severe drought in East Africa and destructive floods in the Indian subcontinent, and a very active North Atlantic hurricane season.
Dr Pep Canadell, CSIRO Research Scientist, and Executive Director of the Global Carbon Project
It is most significant that temperatures haven’t returned to pre-El Niño yet, 1.5 years after it ended. Although we don’t know all the details as to why, the human interference of the climate system has never been so clearly manifested as the background global temperature continues to rise in response to greenhouse gas emissions.
Dr Liz Hanna is an Honorary Senior Fellow at the Climate Change Institute at the Australian National University
Alarming – but not unexpected.
After three consecutive years (2014 to 2016) of world breaking heat records, the World Meteorological Organization now reveals that the exceptional heat of 2017 is likely to come in as second or third hottest. This surge in global warming is alarming, but not unexpected. Global atmospheric CO2 levels are now 46 per cent higher than pre-industrial levels (see graph here: https://scripps.ucsd.edu/programs/keelingcurve/wp-content/plugins/sio-bluemoon/graphs/co2_10k.png).
This escalation of warming should be sending alarm bells to all Australians, as Australia is over 10oC hotter than the global average, and there is an upper limit to human tolerance to heat.
This extra warming brings more frequent, longer and more intense heat waves. Temperatures over 50C are coming, and we simply cannot keep functioning in such temperatures where we cannot move and cannot work without overheating.
Air-conditioning can only ever provide limited relief, and only to some. Trees, animals and people all wilt in the heat.
This surge in warming should prompt a surge in effort to ramp up Australia’s mitigation efforts, transitioning to renewables.
Most importantly, this should further finally stop support for expanding our coal industry. A government that truly represents the nation must prioritise health protection. It is unconscionable to knowingly sacrifice health and wellbeing
