

Multimedia
Attachments
Note: Not all attachments are visible to the general public. Research URLs will go live after the embargo ends.

 Australia; New Zealand; International
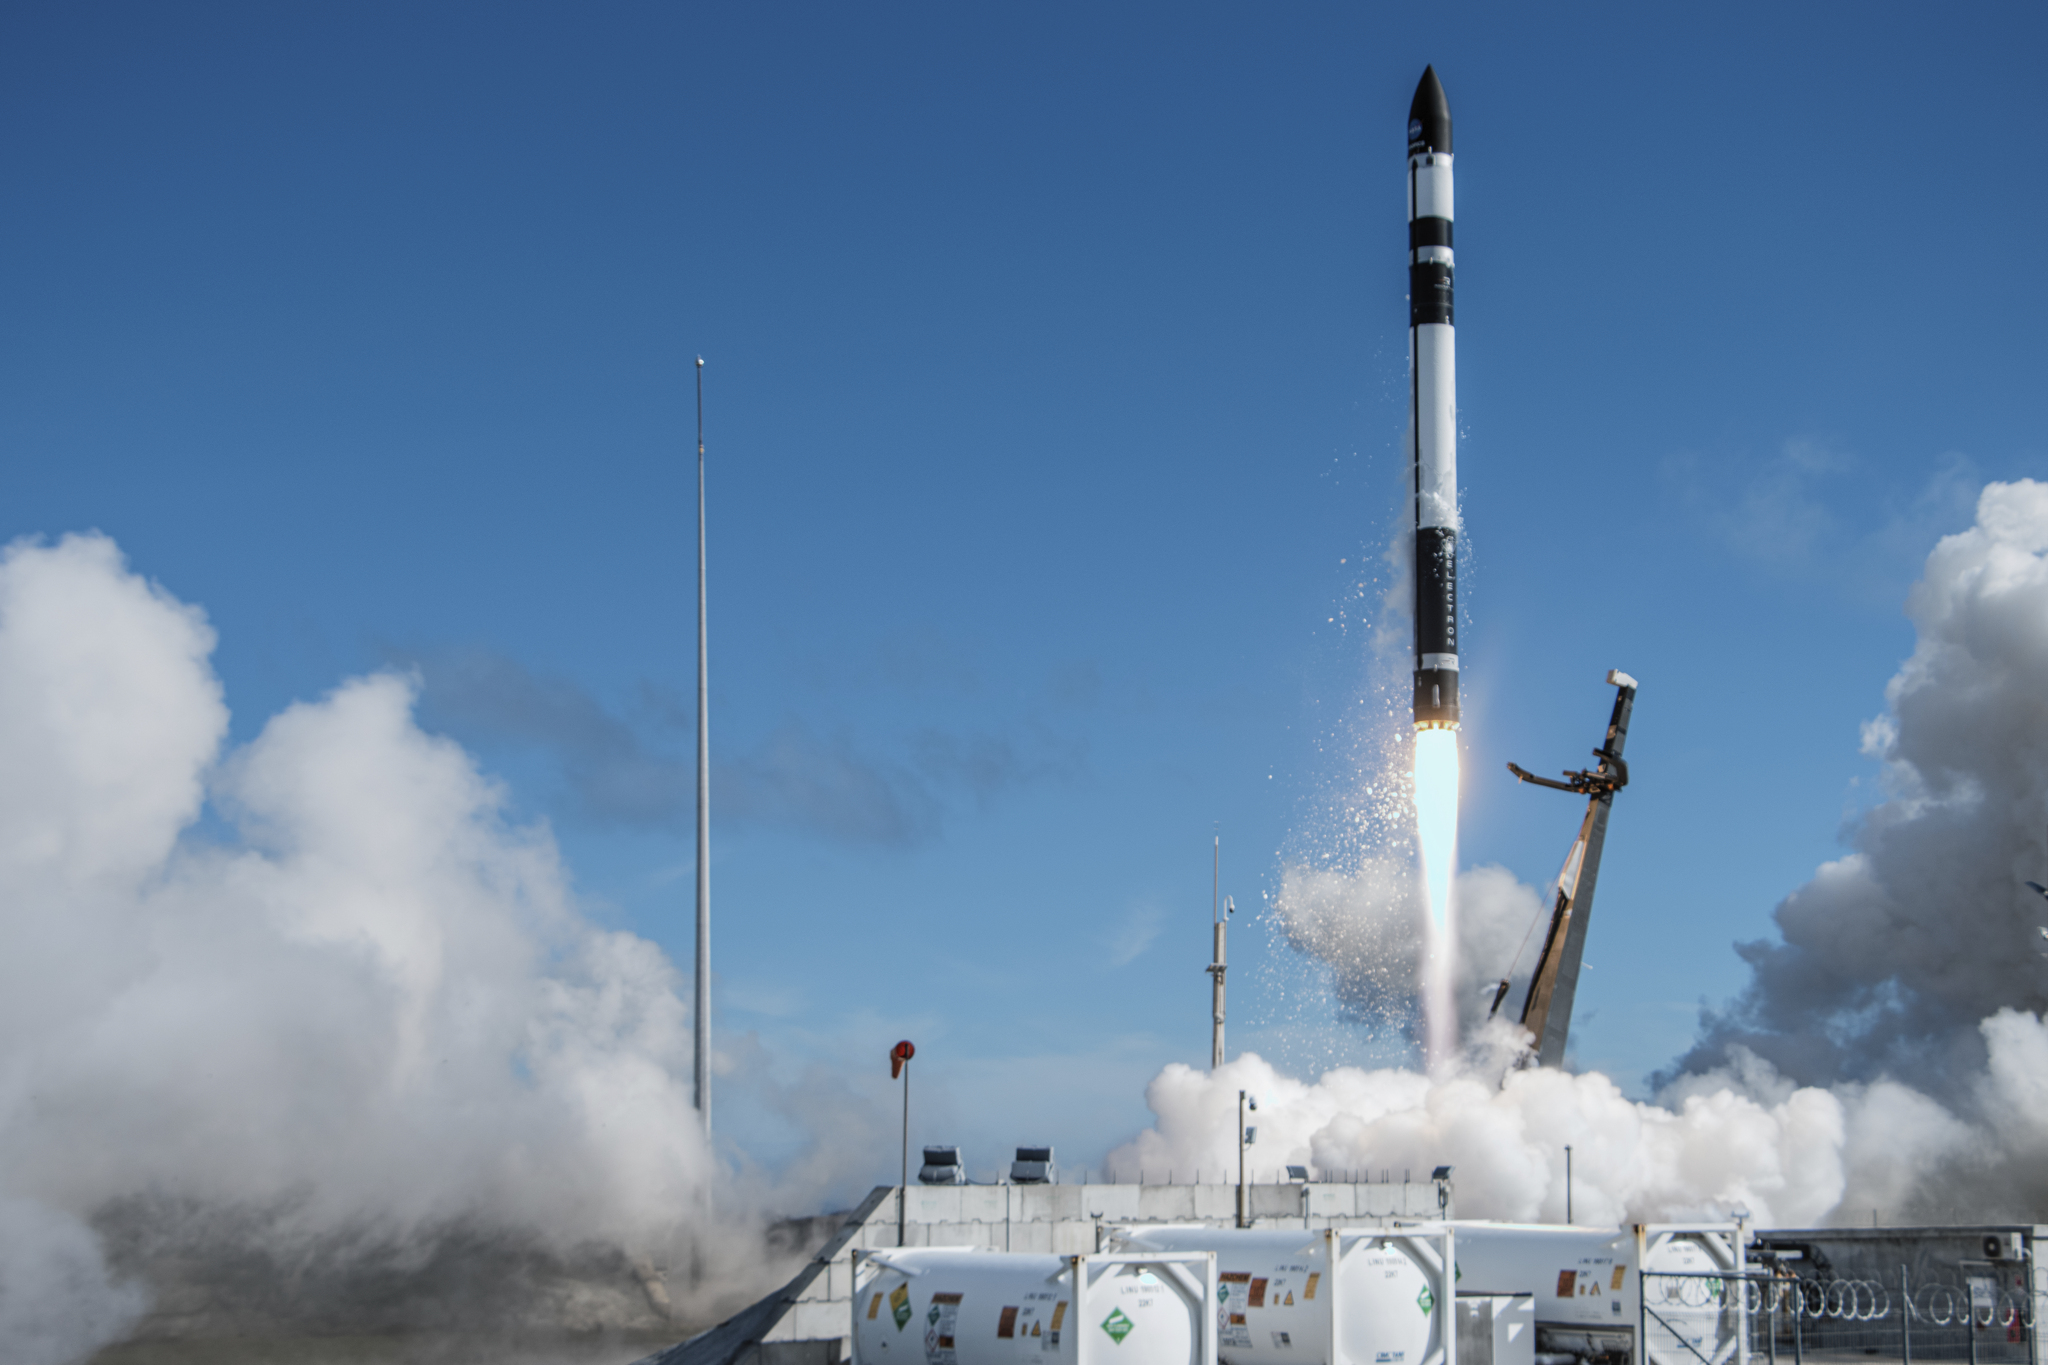
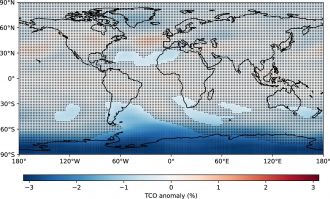
Burning rocket fuel damages the ozone layer, and the burgeoning space industry could make it a lot worse in future. Antarctica, New Zealand, and parts of Australia appear to be the worst off under the 'ambitious' space industry growth scenario modelled by Kiwi researchers. The ozone damage is caused by chlorine and black carbon from propellants used in launches—and the researchers call for restrictions on how often these types of fuel can be used.
Note: Not all attachments are visible to the general public. Research URLs will go live after the embargo ends.

