
 Australia; International; TAS
News release
From:
Australian Antarctic expeditioner Louis Bernacchi archives made publicly available for first time alongside historical weather recordings from Australia
- Louis Bernacchi’s Antarctic weather observations among tens of thousands of historic weather records made available to the public online for first time on Science in the Making portal
- Bernacchi’s handwritten notes and illustrations of aurora australis among the archives
- Over 900 photographs from Discovery expedition to be published as interactive map of the expedition, featuring photographs of Bernacchi, and photos taken by him
- Over 50 sets of meteorological observations taken in and around Australia also among the archive, with oldest records from 1788.
Photograph of Louis Bernacchi making ‘electrometer observations’, captured by Ernest Shackleton; illustrations and pages from Louis Bernacchi’s notebooks. Images here: Antarctica and the Meteorological Archives and highlights below
An archive of over 1600 sets of meteorological, magnetic and tidal observations taken from 1706-1915 from across the globe has been digitised for the first time. The treasure trove of historic weather data and imagery is now available for scientists across the globe to study on the Royal Society’s Science in the Making portal.
The records include observations made by Tasmanian physicist and astronomer Louis Bernacchi in Antarctica during the famous Discovery expedition led by Robert Falcon Scott and Ernest Shackleton from 1901-1904. Bernacchi was the first Australian to set foot on the Antarctic continent during a previous expedition and was the only Australian member of this British National Antarctic Expedition, co-organised by the Royal Society.
As the expedition physicist, Bernacchi was commissioned to record the weather. Audiences everywhere can now discover his observations taken in the coldest, windiest region of the planet. These seven volumes of raw data show temperatures, wind, rain, seismic activity and instances of aurora australis. Bernacchi’s ‘aurora diary’ showing his hand-drawn illustrations of atmospheric electricity can also be explored among the archives.
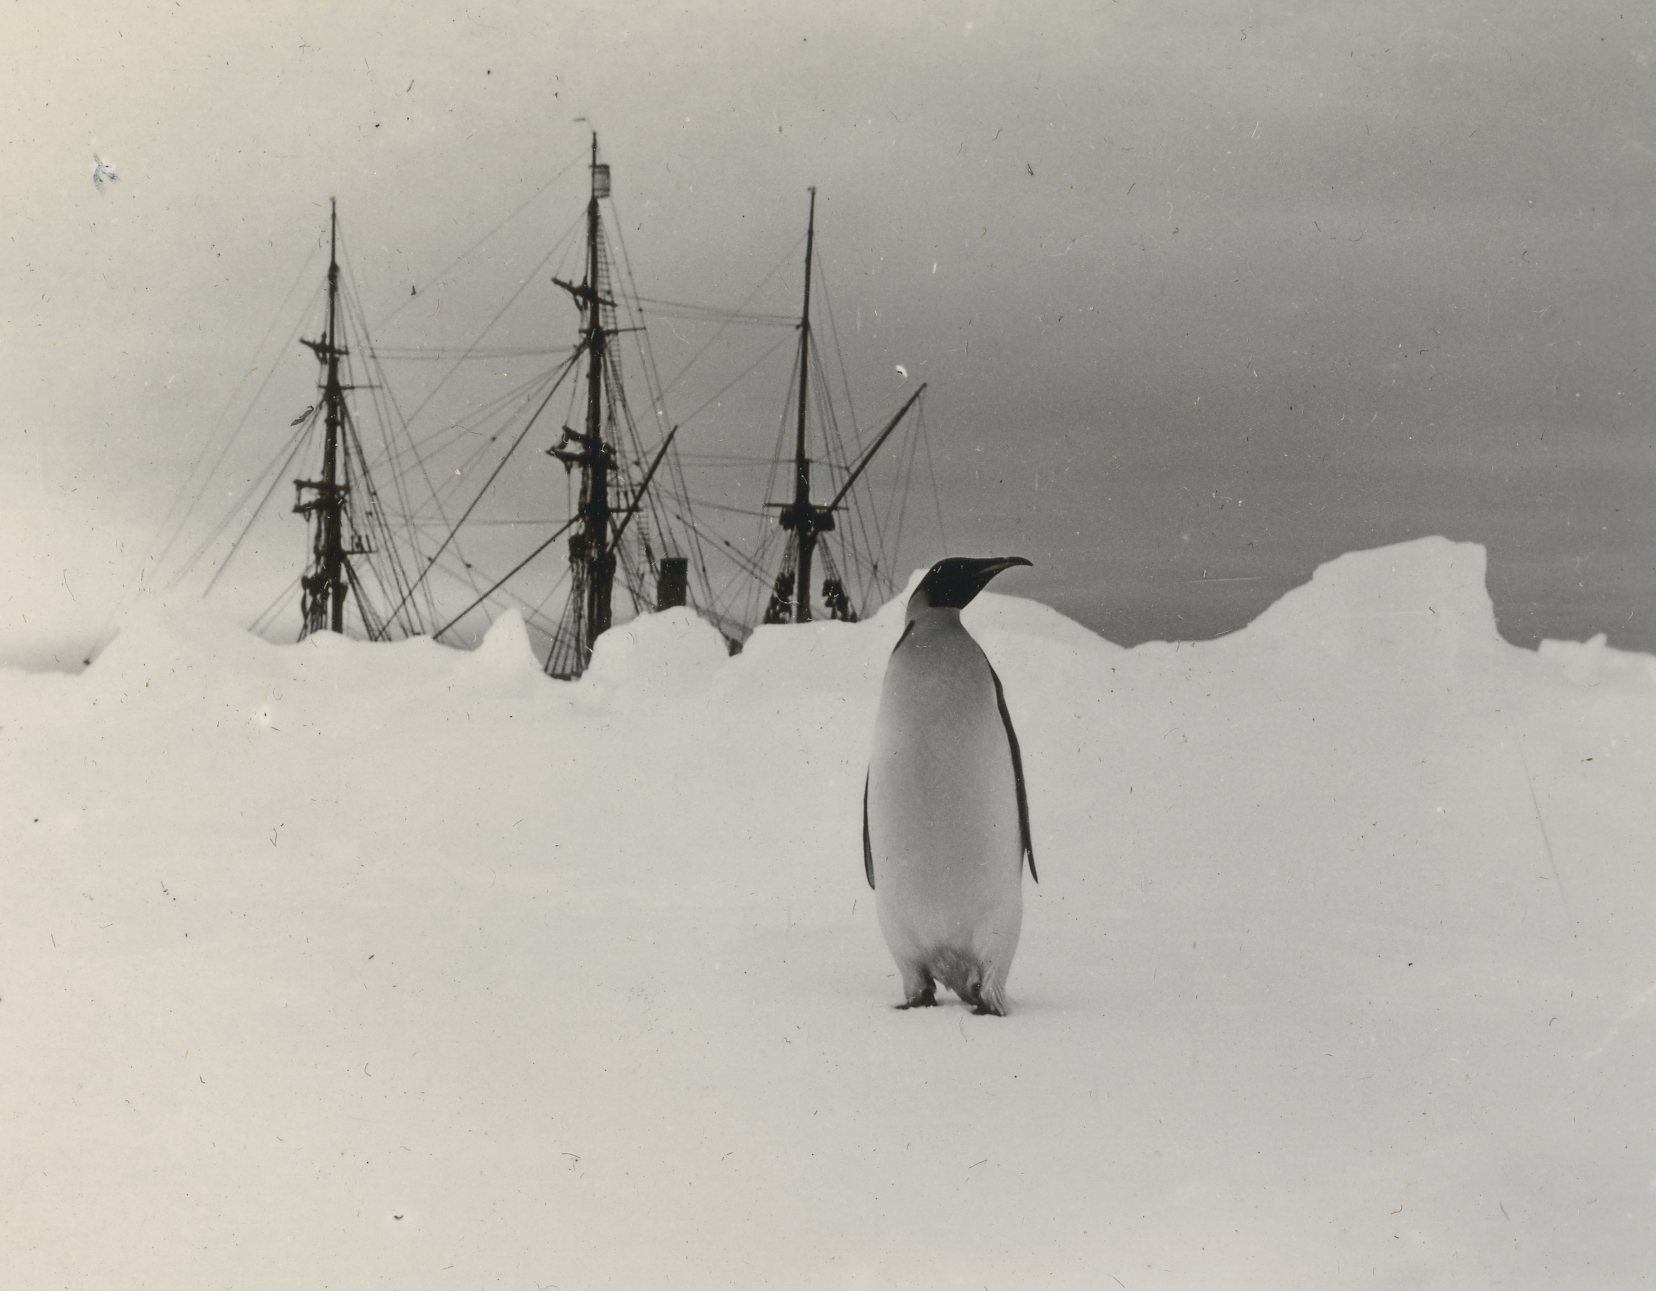
Online audiences can retrace the expedition through over 900 photographs – many taken by Bernacchi – of the crew, the wildlife, the landscapes and the science experiments they conducted along the way. Images include views from the hydrogen observation balloon captured by Shackleton, “peculiar” ice formations, flocks of penguins and a yawning seal.
Also among the archives are over 50 sets of observations taken in and around Australia from as early as 1788, from Port Jackson (the colonial settlement that became Sydney), on the land of the Gadigal people of the Eora Nation.
The Royal Society’s Meteorological Archive was created in 1839, 15 years before the formation of the Met Office (the United Kingdom’s national meteorological service), when Sir John Herschel set up a dedicated ‘department’ for the society’s collection of meteorological manuscripts. This was accompanied by active record-hunting across the Society’s global scientific networks.
Royal Society historian Louisiane Ferlier said, “This vast collection of data represents the birth of meteorology as a rigorous science, where the process of weather recording became standardised to enable weather comparisons on a global scale. It was Herschel’s ambition to make this data open for anyone ‘of every age and nation’ to use. Now we are finally opening up this treasure trove of data and history to the global public and researchers alike, to help fill gaps in our understanding of global climate history.
“We expect that the Royal Society's meteorological archives contain several instrumental weather records older than any previously known for many parts of the globe as well as exceptionally long unbroken series of records, that will be invaluable to climate scientists reconstructing pre-industrial baselines.”
Tens of thousands of individual observations show raw scientific data and weather readings from across all six continents and all oceans, from the Northern shores of Greenland to the Southern ice of Antarctica; tidal observations at London Docks to temperatures in London, Ontario; rainfall in Colombia, to wind direction in Colombo, Sri Lanka. Highlights include a two-meter-long graph showing hourly magnetic observations in Singapore from 1844-45, a watercolour graph of weather readings from a regiment hospital in Karachi, Pakistan, in 1858, and a dodecagon graph showing daily weather readings at Port Arthur, Australia, in 1840.
The meteorological data will be registered as part of the Data Rescue Service supported by the World Meteorological Organization (WMO) and Copernicus Climate Change Service (C3S) Data Rescue Service, under the leadership of the Royal Netherlands Meteorological Institute (KNMI).
Highlights from the archive:
- Photographs taken by Louis Bernacchi in Antarctica during the National Antarctic Expedition from 1901-1904
Photographs of the landscape include 'Mount Melbourne, Wood Bay', a large snow-covered volcano in Victoria Land on the Antarctic mainland, taken on 19 February 1903. Bernacchi also took photos of his fellow crew members, including this image of expedition biologist, Thomas Vere Hodgson, with a small sledge loaded with two repurposed Cadbury’s chocolate crates.


- Louis Bernacchi’s ‘aurora diary’ made during the Discovery expedition, 1902-1904
Louis Bernacchi’s ‘aurora diary’ of atmospheric electricity readings and illustrations will be among the archives, in which he and other expedition personnel (including Scott) record instances of the aurora australis.


- The oldest record from Australia dates back to 1788
This 115-page journal shows weather readings at Port Jackson (the colonial settlement that became Sydney), on the land of the Gadigal people of the Eora Nation, from September to December 1788. The observations were made by Lieutenant William Dawes, a member of the First Fleet, who would later set up an observatory on what is now Dawes Point. The first written ‘remark’ notes that on 14 September 1788, at “about 7 it began raining”.


- Dodecagon graph showing temperature, wind and other weather observations at Port Arthur, Australia, made by Thomas James Lempriere, c. 1840
This unusual twelve-sided graph shows weather observations in Port Arthur, Van Diemen’s Land, present day Tasmania, made by naturalist Thomas James Lempriere. Lempriere kept daily records of tide levels at Port Arthur from 1837 to 1842, which were published in Philosophical Transactions of the Royal Society.


Attachments
Note: Not all attachments are visible to the general public. Research URLs will go live after the embargo ends.


