New Zealand
News release
From:
New maps show coastal sites with high rates of subsidence and increased flood risk as sea-levels rise
Coastal sites subsiding at rates of up to 10 mm/year, making them more vulnerable to sea-level rise, have been pinpointed in new high- resolution maps of five major urban centres.
“This high rate of subsidence effectively doubles the sea-level rise we are already seeing at some sites. By 2100, the additional subsidence will be up to one metre, enough to overwhelm many coastal sea defences,” said lead researcher Dr Jesse Kearse, who worked on the maps as part of his PhD in geophysics at Te Herenga Waka—Victoria University of Wellington.
The high-resolution maps were created using radar images collected by satellites between 2018 and 2021. The images, coupled with existing data, enabled detailed analysis of land movement along the coastline in Auckland, Tauranga, Wellington, Christchurch, and Dunedin.
“We know ongoing sea-level rise threatens to be a major problem for coastal infrastructure in New Zealand. Coastal subsidence—particularly in areas where we’ve modified the shoreline through land reclamation—is exacerbating the problem.
“Our analysis showed that about a third of sites are subsiding fasting than 2 mm/year. A few millimetres a year may not sound like much, but over several decades it can result in changes of tens of centimetres, enough to have a major effect on coastal defences.
“This subsidence is also occurring when sea levels are projected to rise at around 5 mm/year in New Zealand, which means these areas are likely to be at significantly greater risk from flooding,” said Dr Kearse.
Areas with high rates of subsidence included reclaimed land in Auckland along the south Onehunga coastal strip. This area, which has large warehouses, was subsiding rapidly at 3 to 10 mm/year, he said.
High rates of subsidence, up to 12 mm/year, were also identified on the eastern margin of Auckland’s port. On Auckland’s North Shore, a 500-metre stretch of highway built on reclaimed land was subsiding at up to 6 mm/year.
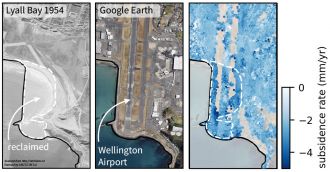
In Wellington, the lowest-lying section of the airport runway was identified as a subsidence “hotspot”. The southern end of the runway, which is on reclaimed land, was subsiding at 3 to 4 mm/year. Areas of high localised subsidence were also identified at Wellington’s CentrePort.
However, Dr Kearse said not all reclaimed land in Wellington was a hotspot for subsidence:
“For instance, large swaths of reclaimed land at Evans Bay and along most of Wellington’s waterfront at Thorndon are not sinking any faster than the regional average.”
In Christchurch, the coastal strip between New Brighton and Southshore was found to be subsiding very rapidly at between 4 to 9 mm/year. This sinking was related to “ongoing deformation above the source area for the 2011 Christchurch earthquake sequence, rather than land reclamation,” he said.
Within Lyttleton Harbour, there was localised subsidence on reclaimed land of up to 6.5 mm/year.
Dr Kearse said the findings show rates of subsidence are higher than previously thought. Of the centres included in the research, Christchurch had the highest average rate of coastal subsidence at 3.6 mm/year.
Average subsidence rates in other areas were:
2.4 mm/year in Wellington
1.9 mm/year in Lower Hutt
1.8 mm/year in Porirua
1.8 mm/year in south Auckland
1.6 mm/year in Dunedin
1.5 mm/year in north Auckland
0.6 mm/year in Tauranga
“Across all centres, the highest subsidence rates were occurring along coastal areas where land was reclaimed in the 20 th century as well as in areas that have recently been cut and filled. Sites with uncompacted sediment were also more likely to have high subsidence rates.”
Dr Kearse said the findings add to knowledge about the vulnerability of coastal areas to sea-level rise.
“Given projections for future sea-level rise, it’s crucial we have accurate information about land movement along our coastlines, especially in large urban areas where most of us live. Our data comprise a snapshot of land subsidence in recent years, but continued monitoring
is needed to understand the ongoing hazards along urban coastlines. Remote sensing datasets collected by satellites, such as the dataset we used, are providing a cost-effective way to meet the need for accurate information about vertical land movement.”
Results of the research have been published in the New Zealand Journal of Geology and Geophysics.
Multimedia