
 New Zealand
News release
From:
Shaking up earthquake information on GeoNet
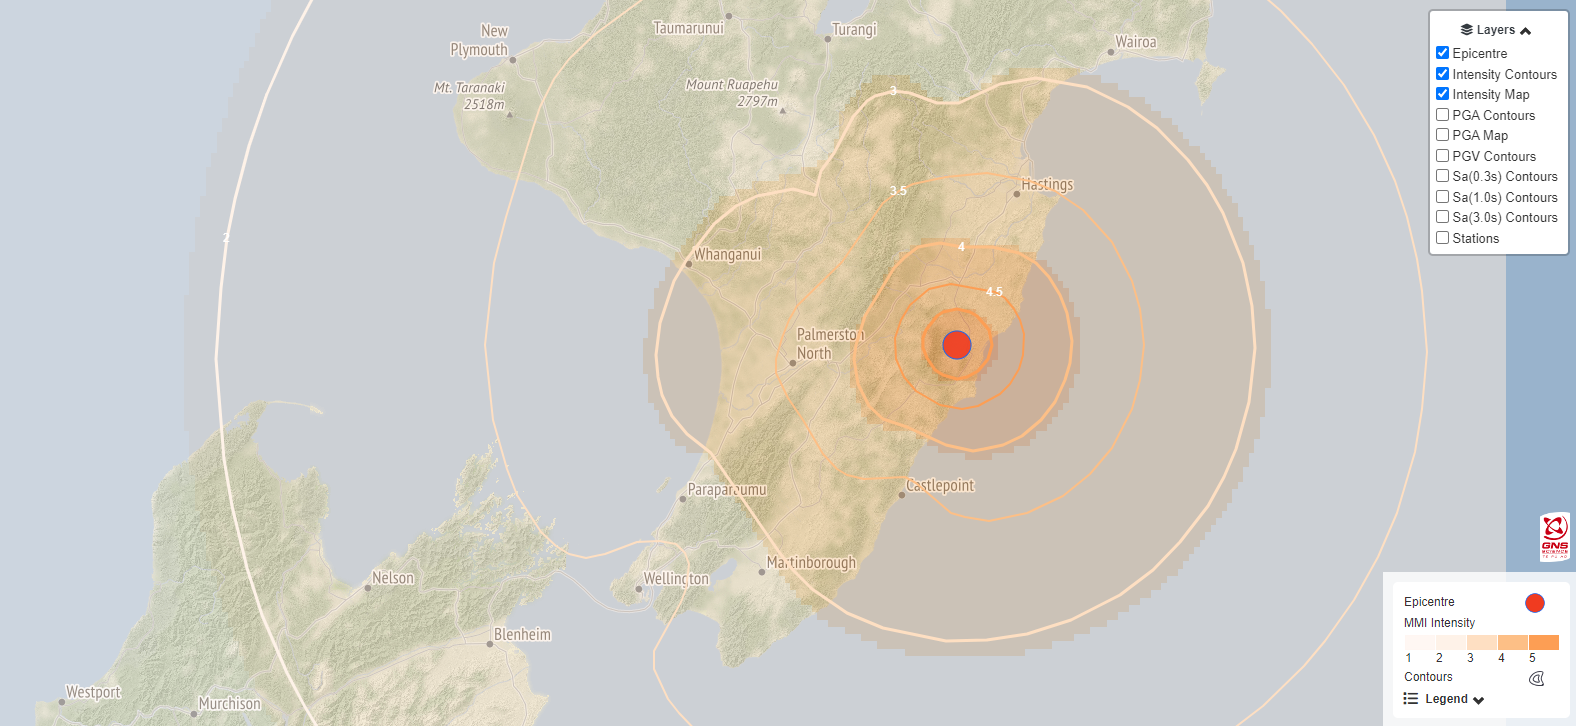
From today, visitors to the GeoNet website can view dynamic ‘Shaking Layers’ maps, which illustrate the intensity of ground shaking caused by earthquakes in different parts of the country.
The maps incorporate data from ground motion sensors and are automatically produced within 10 to 20 minutes of a magnitude 3.5 or greater earthquake. Users can zoom into the map and get a measure of how strong the shaking was in any area.
Like the ‘Felt it’ reports that scale up from unnoticeable to extreme, the measure of shaking intensity is underpinned by the modified Mercalli intensity scale, which indicates the earthquake’s effect on people and their environment. For example, people in an area with a shaking intensity measure of 4 can expect light shaking, where walls may creak, and windows may rattle.
GNS Seismologist and Shaking Layers technical leader, Dr Nick Horspool, said Shaking Layers has multiple uses for multiple users.
“For the public, the maps can be explored out of curiosity to see if the shaking intensity they felt in their location matches what the data tells us, or they can check on the level of shaking friends and whānau may have experienced where they are,” Dr Horspool said.
Shaking Layers can aid emergency response by indicating both the level and location of potential damage to buildings and infrastructure, which can support emergency responders to target their resources where they are needed most.
“Importantly, the availability of these maps and ground motion data following an earthquake can help reduce the risks to people and infrastructure by supporting emergency response, engineering assessments, infrastructure management and research into disaster risk reduction.”
The automated maps may be updated by GNS seismologists as more information becomes available, particularly for large events where an earthquake can rupture the subsurface for tens to hundreds of kilometres, meaning severe shaking may occur far from the epicentre. See the Kaikōura earthquake case study below for more detail.
Shaking Layers combines recorded data from strong motion stations with ground motion models to produce spatial estimates of ground shaking for each intensity measure. Maps of peak ground acceleration and velocity and spectral acceleration can also be viewed.
Shaking Layers can be viewed on the GeoNet website at www.geonet.org.nz/earthquake
Development of Shaking Layers
Shaking Layers has been developed by GeoNet and the Rapid Characterisation of Earthquakes and Tsunami Endeavour programme (RCET). Shaking Layers Business Manager, Elizabeth Abbott, said the development of Shaking Layers has been a strong collaborative effort across the organisation.
“Bringing together our expertise from a science, technical and user perspective has delivered a robust and resilient tool that we know is really important to stakeholders,” Ms Abbott said.
GNS Seismologist and Shaking Layers Project Leader, Dr Tatiana Goded, said the Shaking Layers team worked with a Science Advisory Panel to ensure the science behind the map development is up-to date and robust.
“We also co-created the maps with an End-User Advisory Panel to develop a tool that is fit-for purpose. We want to ensure all users will find it useful, from emergency managers and first responders to the public,” Dr Goded said.”
Felt Detailed reports submitted by general users through the GeoNet website are also manually included when there are enough reports to produce quality data. In this way, the public contributes to science by providing observational data alongside the strong-motion sensors.
Kaikōura case study
GNS Seismologist and Shaking Layers lead scientist, Dr Anna Kaiser, explains how Shaking Layers combined with our earthquake science can provide critical information following a large earthquake event.
“Following a large earthquake (>M6.5), the first automated Shaking Layers maps can be less accurate.
“In the case of the Kaikōura earthquake, ground shaking recorded at seismic stations in the Marlborough region was much higher than what we might expect from the first Shaking Layers models. This is an important trigger for our expert seismologists to review the data and apply other sophisticated tools to rapidly improve our first shaking maps,” Dr Kaiser said.
“If the Kaikōura earthquake happened today, the automated Shaking Layers maps could be quickly reviewed and updated with tools developed by scientists to map the earthquake size, characteristics, and fault rupture extent. The R-CET programme is currently developing tools like this to run in near real-time, to allow us to update maps more quickly.
“Once fault rupture information is included, Shaking Layers maps clearly show that severe shaking extends all the way to northern Marlborough, and significant shaking also occurs in Wellington.
“We can now produce these maps much more quickly during a response, which helps emergency responders understand which regions are most affected. If we’d had this model following the Kaikōura earthquake, it could have been used to flag potential damage to buildings and infrastructure extending to the Cook Strait region.
“We are continuously developing these rapid tools so they can help in the many diverse types of large earthquakes we might see in the future, for example large subduction zone ruptures.”
Shaking Layers maps can continue to be improved for weeks to months following a large earthquake.

