
 New Zealand
News release
From:
Key points
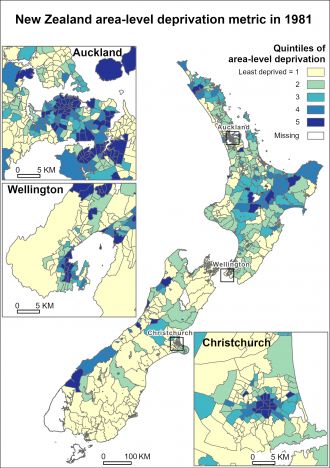
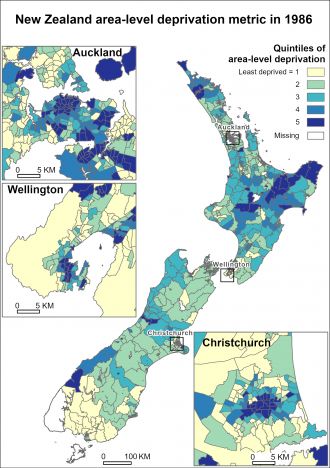
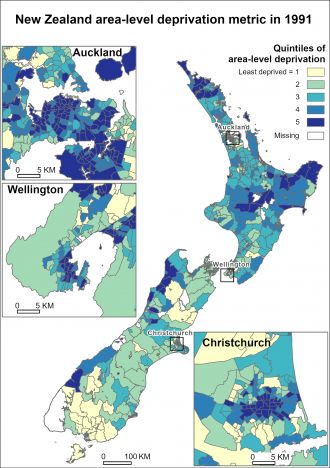
1. This study developed a consistent time-series area-level deprivation metric in 1981, 1986 and 1991 in New Zealand at the Census Area Unit level.
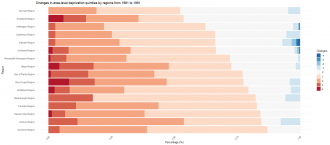
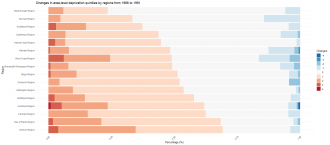
2. There was a consistent increase in area-level deprivation across the country from 1981 to 1991. Notably, areas such as the far north, central and eastern North Island, and the west coast of the South Island remained the most deprived throughout this period.
3. Most metropolitan areas showed higher levels of deprivation in their city centres compared to their outer fringes.
4. This historically relevant time-series area-level deprivation metric extends the understanding of area-level deprivation across the 1980s, as previous data on area-level deprivation in New Zealand were only available starting from 1991.
5. This metric holds importance by providing insights into persistent area-level deprivation over time, which may help with directing resources towards underserved and marginalised areas, evaluating past policies, and informing future planning.
Lay summary
This paper describes the development of a metric that measures levels of socio-economic conditions at the small area level in New Zealand over time, focusing on the years 1981, 1986, and 1991. Our analysis of this metric shows that levels of socio-economic conditions generally worsened across all areas during this period, with areas such as the far north, central and eastern North Island, and the west coast of the South Island consistently experiencing the most severe deprivation. This metric helps us to understand which areas have experienced long-term socio-economic deprivation, which can guide the allocation of resources, evaluate past policies and inform future urban and social planning.
Multimedia
Attachments
Note: Not all attachments are visible to the general public. Research URLs will go live after the embargo ends.


