Australia; SA; WA

News release
From:
h-index, g-index, i10 index, m-quotient, Journal Impact Factor, Altmetrics … it’s long been an intractable issue plaguing the research community — how to assess the relative merits of research objectively across disciplines and make fair comparisons between early career and established researchers, different genders, and even different research disciplines.
Now, Flinders University ecologist Professor Corey Bradshaw and colleagues have developed a tool to assess research performance more fairly; one that will level the playing field not just across disciplines, but across genders and careers paths, ironing out the wrinkles for disruptions such as maternity leave.
Called the Epsilon Index, named for the Greek letter ε used to symbolise residuals in statistics, it takes into account the many differences in the research space to deliver a fairer comparison.
A self-confessed statistics wonk, Professor Bradshaw has published the workings of the ε-index in the open-access journal PLoS One.
‘One of the enduring challenges for researchers is the quest to measure the quantity and quality of their output fairly,’ Professor Bradshaw says.
“There’s no straightforward process to compare the relative strengths of researchers in disparate disciplines — some just tend to have fewer citations than others.
‘Then there’s gender. Research publications for women might dip during maternity leave for instance, affecting perceived performance, even though their ability — and their research — is no less brilliant. Women also tend not to be offered the same opportunities as men even today, so they are unfairly ranked against men for most existing metrics.
‘Where researchers are in their career, be they exciting newcomers or distinguished professors, can also have a strong effect on current metrics.
'The Epsilon Index is a new way to reduce systemic biases in assessing researcher quality via citations by providing career-stage, gender, and opportunity corrections to citation-based performance metrics,’ he says.
The tool is freely available as a ready-made app — simply punch in a few data for a sample of researchers from open-source databases like Google Scholar, and it does the heavy lifting to produce the result, enabling comparison of researchers at any stage of their career and from any discipline on the same scale.
It’s a boon for anyone who wishes to use an objective metric to rank researchers, be it for grant applications, job interviews, promotions and awards, or even as a staff performance indicator.
The approach to develop and test the ε-index was itself an exercise in multi-disciplinarity and specifically engineered to ensure gender balance.
The tool was tested and refined through collaboration on sample data with an archaeologist – Assistant Professor Dr Stefani Crabtree (Utah State University/Santa Fe Institute), a geologist and vertebrate palaeontologist – Professor Kate Trinajstic (Curtin University), a chemist – Professor Justin Chalker, a microbiologist – Professor Bart Eijkelkamp, a palaeontologist – Professor John Long, an ophthalmologist – Professor Justine Smith, and an evolutionary biologist – Professor Vera Weisbecker (all Flinders University).
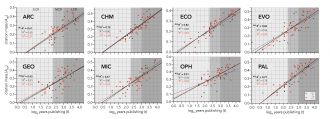
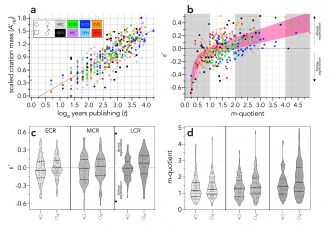
The sample comprised 480 researchers with Google Scholar profiles, stratified evenly into eight disciplines (archaeology, chemistry, ecology, evolution and development, geology, microbiology, ophthalmology, palaeontology), three career stages (early-, mid-, late-career), and two genders.
Professor Justine Smith, who’s been a ‘superstar of STEM’ actively promoting women’s engagement in science, technology, engineering and mathematics, hopes the ε-index will make a difference to how women in science are perceived, and in turn encourage more women to enter the sciences.
‘More accurately assessing the contribution of women to the sciences and celebrating their successes is pivotal to encouraging future generations of girls into the sciences; as the saying goes, “you can’t be what you can’t see”. The ε-index gives fairer and greater visibility to women’s achievements, and that it does so across a range of disciplines makes it especially beneficial,’ Professor Smith says.
How it works
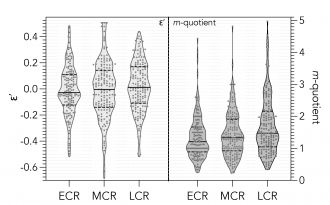
The new index is a ranking algorithm that can be standardised across disciplines, can be corrected for career breaks, and provides a sample-specific threshold that can determine whether individual performance is greater or less than expected relative to the other researchers in a sample.
Using either the R code or online app, it requires just four items of information from public databases such as Google Scholar or Scopus to calculate a researcher’s ε-index:
· the number of citations acquired for the researcher’s top-cited paper
· the i10-index (number of articles with at least 10 citations)
· the h-index, and
· the year in which the researcher’s first peer-reviewed paper was published.
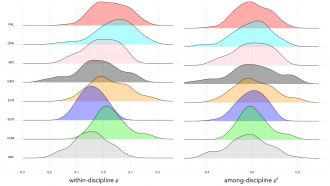
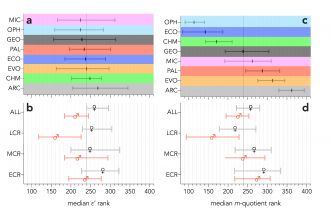
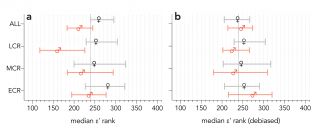
The tool also provides a simple method to scale the index across disciplines with variable citation trends (ε′-index) to enable fairer comparison of researchers in different areas.
The ε-index easily allows benchmarking of subsets of researchers into women-only or men-only to adjust the threshold such that the ranks are more comparable between these two genders. Alternatively, dividing the genders and benchmarking them separately followed by a combined re-ranking effectively removes the gender bias in the ε-index, which is difficult or impossible to do with other ranking metrics.
‘No ranking metric is perfect, but the ε-index is a big leap forward in overcoming bias and giving a clearer, fairer picture of research performance across the board,’ Professor Bradshaw says.
Multimedia