Media release
From: Monash UniversityWhile Germany, Italy and the United States will participate in the G7 summit as global leaders in green competitiveness, Australia will attend as a ‘green laggard’, according to a new global analysis published today involving Monash University.
The report ‘Navigating the green transition: insights for the G7’ by Dr Penny Mealy from SoDa Labs in the Monash Business School and Pia Andres of the Grantham Research Institute on Climate Change and the Environment at the London School of Economics and Political Science, presents an analysis of green competitiveness since 1995 of the 11 countries attending the G7 Leaders’ Summit, as well as China.
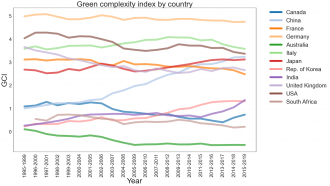
It finds Germany has consistently ranked first in the world in terms of the range and number of complex and technologically advanced green products that have been shown to be strong drivers of economic development and growth.
Italy overtook the United States in the 2000s and currently occupies second place in the world rankings. Other leading nations include China, Japan and the United Kingdom.
However, Australia’s green competitiveness has significantly declined over the past 20 years and it now barely ranks in the top 100 of 231 countries and territories that were assessed (ranked #96).
Of the countries considered, Australia appears to be in the least favourable starting position to competitively export products with environmental benefits. Australia is cited to have just 12 ‘green strengths’ compared to 59 in Canada and 153 in China.
“It’s heartbreaking to see Australia lagging other nations, when it really ought to be a leader,” Dr Mealy, Research Fellow within SoDa Labs in the Monash Business School and Research Associate at the University of Oxford, said.
“The writing has been on the wall for some time. Demand for emissions-intensive products is on the decline, and countries are now seeking to preferentially favour trade in green goods.”
The authors carried out the new analysis with a new tool, the ‘Green Transition Navigator’, that was launched earlier this year and based on research published last year in the journal ‘Research Policy’. The Green Transition Navigator maps strengths and opportunities in the green economy for 231 countries and territories.
The tool shows each country’s Green Complexity Index (GCI), which measures both the number and the complexity of green products that it is able to export competitively. It also shows Green Complexity Potential (GCP), which measures the relative ease with which a country can become more competitive in new, technologically sophisticated green products and technologies.
Some existing green competitive strengths for Australia include electric signal, safety and traffic controls and rail/tramway construction materials, which are likely to be in greater demand as greater investments are made in cleaner modes of public transport.
When it comes to green potential opportunities, Australia has comparably low proximity to most of the green products used in this analysis. Some relatively proximate opportunities include tamping machines and road rollers, which are used in recycling and solid waste treatment processes.
However, the underlying data does not yet capture the ‘greenness’ of countries’ production processes. For example, Australia’s strong potential to capture products such as ‘green’ steel, which is made from hydrogen rather than coal, is not yet accounted for.
“China has rapidly increased its competitiveness in green products over the past 20 years and is now the world leader in exporting solar photovoltaic cells, fuel cells and electric soil heating apparatus, among other products,” Dr Mealy said.
“Australia, on the other hand, has seen a significant decline in its green production capabilities over the past two decades and now lags behind many countries in terms of its capacity to competitively export products relevant to the green economy.
“It is now mission critical for Australia to get more proactive about decarbonising our production processes and investing in the new productive capabilities that will allow it to thrive in the green economy.
“Australia has incredible endowments in renewable energy, and also has a fairly decent track record in green patenting, but its global export competitiveness is still currently underpinned by coal, gas and iron ore.”
Ms Andres said: “Our analysis shows that Germany has consistently held its position as a ‘green leader’, followed by Italy and the United States. These countries currently have productive capabilities that allow them to competitively export a wide range of ‘complex’, or technologically sophisticated, green products.
“While competitiveness in green products allows countries to take advantage of the green transition, competitiveness in products with higher complexity is also important, as it has been shown to enhance countries’ overall economic growth and diversification prospects.”
Climate change and the transition to net-zero have risen to the top of the policy agenda in many countries in recent years and are expected to be an important topic of discussion at the G7 summit 2021.
APPENDIX
Methodology
The Green Transition Navigator and the analysis presented in this report are based on previous research by Mealy and Teytelboym (2020), which developed a quantitative methodology for measuring countries’ current green production capabilities, identifying new green export opportunities, and predicting future green export growth.
Data
The dataset of green products and technologies referred to in this report are based on a compilation of the APEC, OECD and WTO green goods classifications. Country-level trade data is sourced from CEPII's BACI database (Gaulier and Zignago, 2010). To avoid measurements being skewed by short-term fluctuations in trade, the analysis is based on annual averages in trade values for rolling 5-year-periods from 1995-1999 to 2015-2019 (where no time range is shown, the data is based on the most recent period, which is 2015-2019).